Figuring out CPU usage on dual core (dual/quad core) systems
Introduction
All I wanted to do was see how much CPU was being used by my simple program ( an infinite loop). This used to be a matter of writing a simple infinite loop – such as the one shown below (while (true) {}), firing up the performance monitor and viewing the CPU Usage (as shown in the figure on the right below)
private static void SimulateCPUSpike()
{
while(true) { }
}
When I ran this on my dell laptop, I never saw the CPU usage go above 25%. This was due to a dual core processor – which meant that effectively my (single threaded) console app was only running on one of the two cores. The other core was still available to handle everything else. So – what does the Total Processor Time counter really tell us on multi-core systems? Not much as per Microsoft documentation:
Total Processor Time on multi-core systems is misleading (as per Microsoft’s Documentation)
On a multi-processor computer, the System:% Total Processor Time counter can mask a processor bottleneck because it represents the the total processor time for all processors divided by the number of processors. If one processor is overloaded and creating a bottleneck while the other processors are idle, System:% Total Processor Time might be quite low, but the overworked single processor is blocking the computer. On a multi-processor computer, examine the Processor:% Processor Time counter determine up any imbalance.
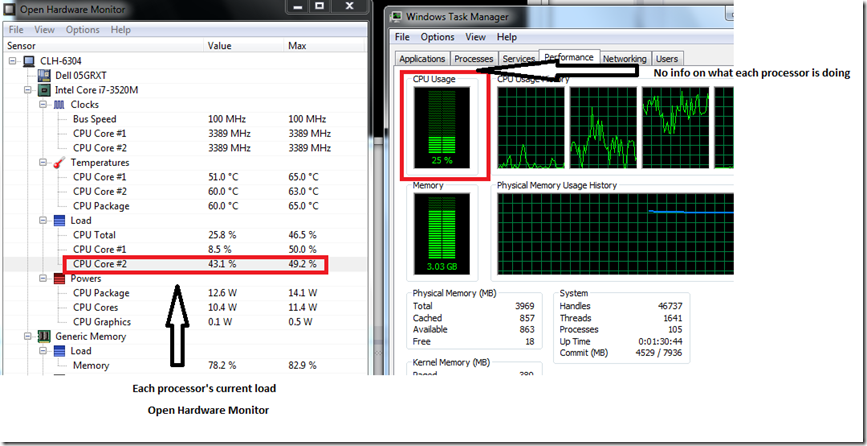
But that just begged the question – how much was each CPU core stressing out due to my program? This information was not available on the windows performance monitor. Fortunately, I found a free tool (Open Hardware Monitor listed below) that provided me with exactly that info (per core CPU usage).
Open Hardware Monitor
This tool (open source) lets you view each CPU’s individual load – exactly what I needed to see. As suspected, one of the cores was up to 50% and the other one wasn’t being stressed out at all. See the screenshot below to get an idea of what the per CPU load should look like (on the left). The right image (Perf Mon) has no individual processor info.
Summary
Viewing actual processor usage by your software (how much your software is stressing out the CPU) has become more challenging – with the advent of dual core and dual/quad processor systems. Windows’ built in performance monitor does not provide an easy way to see per-core CPU usage. Fortunately, a free utility – Open Hardware Monitor – lets you view just that (along with other hardware specific metrics).

Leave a Reply