Quick deadlock inspection in SQL Server
Introduction
Deadlocks occur when multiple processes (usually two) are trying to access the same resource. Sql Server decides – after a specified period of time – to terminate one of the processes – so the other can move forward. The terminated transaction is rolled back. Unfortunately, nothing in the SQL Server Error Log or the Windows Event Log provide detailed information (or any information) about the deadlock. All SQL Server does is sends back a message to the client:
Transaction (Process ID xx) was deadlocked on {xxx} resources with another process
and has been chosen as the deadlock victim. Rerun the transaction.
Two methods (Client side tracing and Server Side tracing) for discovering detailed information about the underlying transactions involved in the deadlock are described in this post.
Client side Tracing
Quick inspection of deadlock events (Client side detection of deadlocks) – capture the events by enabling the right trace flags:
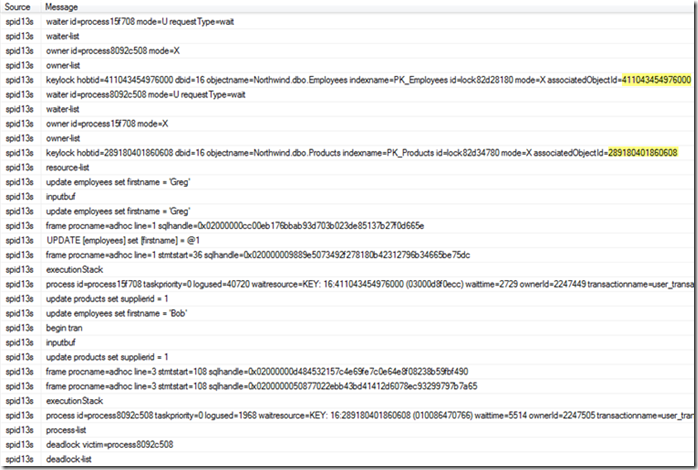
DBCC TRACEON (1204, -1) – this provides information about the nodes involved in the deadlock
You will see output similar to the following – which will identify the nodes (keylock …..associatedObjectID)
Once you have the associated objectID, you can drill down to figure out the actual involved schema object using the query below:
SELECT OBJECT_SCHEMA_NAME([object_id]),
OBJECT_NAME([object_id])
FROM sys.partitions
WHERE partition_id = ID_FROM_ABOVE;
Server Side Tracing
Run a profiler trace and select the following events (all found under the ‘Locks’ events group)
- Deadlock graph
- Lock: Deadlock – Two concurrent transactions that have deadlocked will raise this event
- Lock: Deadlock Chain – Chain for each of the events leading up to the deadlock
The output of the trace shows a graph which looks like the following. It contains the two processes (Ovals) and the one that was terminated (marked with an X). To identify the underlying sql statements that were part of the transaction, hover over the the X – and you have your culprit.
Blocking versus Deadlocks versus Timeouts
Blocking (Live locking) is not the same as a deadlock – though it can lead to a deadlock. Some amount of blocking is normal – and to be expected – though deadlocks are not. Blocking can also lead to client timeouts. This post discusses the difference among these three related concepts. Here is a recap (if you want to skip reading the post).
Blocking (also known as live locking) occurs when a process attempts to acquire a lock on a resource, but has to wait in the locking queue before the lock is granted. To quickly see all blocked requets,
SELECT session_id ,status ,blocking_session_id     ,wait_type ,wait_time ,wait_resource     ,transaction_id
FROM sys.dm_exec_requests
WHERE status = N'suspended';
GO
From the outside, it appears that the process is doing nothing, when in fact it’s waiting for the other process(es) to release the lock(s) ahead of it in the queue.
If a process is blocked for too long, this can lead to timeouts. If locks are acquired in a specific order, blocking can lead to deadlocks.
The thing to remember is that blocking occurs all the time to synchronize access to resources. It only becomes a problem when the amount of time a process spends waiting becomes excessive, either because it’s causing timeouts, or because it’s causing a user to wait for more time than they expect is normal. Blocking may also be experienced as a “frozen” application. Users may not complain about blocking until their work is impeded enough to frustrate them into taking action to get the problem fixed.
Summary
Deadlocks – especially in production – are a source of potential performance degradation. To quickly identify the underlying transactions that are causing the deadlock, use either client side tracing (quick – but not as detailed) or server side profiler tracing (detailed information).


Leave a Reply