Using TTFB to distinguish between server side and client side page load issues
Introduction
This is just a quick note to highlight a commonly used web testing metric for making an initial determination of where the source of bottleneck(s ) might be.
TTFB
Most commonly, testers measure the total response time for a web page. This is the total time for the server to respond – and then the page to load (completely) in your browser. While this is useful, it does not tell you how long the server actually took to respond to your request (since it includes BOTH server and CLIENT (browser) side load times).
To simplify this measurement, another metric called the Time to First Byte (TTFB) is used. This is JUST the server’s response time – not including the page load time.
The significance of TTFB is that it helps us make a quick determination of how fast or slow the server is at handling a single request.
Server Side Issue / Slowness
A high TTFB implies a server side problem. If it is taking the server a long time to return the first pieces of data, chances are that there is/are server side bottlenecks.
Client Side Bloat
A low TTFB – but a high page load time, would mean there are front-end issues (CSS, images, scripts). This is especially useful since these issues can be easily and quickly addressed (by techniques such as image compression, CSS and javascript compression etc.).
Free Tools to determine TTFB
Fiddler
Using something called a Timeline View in Fiddler, one can see the entire lifecycle of a server’s response (new to fiddler or load testing?). Here is an example of an actual timeline showing both TTFB and total response time (including client side page load time). In this example, the TTFB is relatively short – and the total response time (including page load) is relatively long. This points to a client side bloat (excessive javascript , css and image sizes…). To figure out exactly how large each of these client side pieces are – you can use the other tool listed below – WebPageTest.org.
Fiddler’s timeline view – showing TTFB and Total Response (including Page Load) time
WebPageTest.org
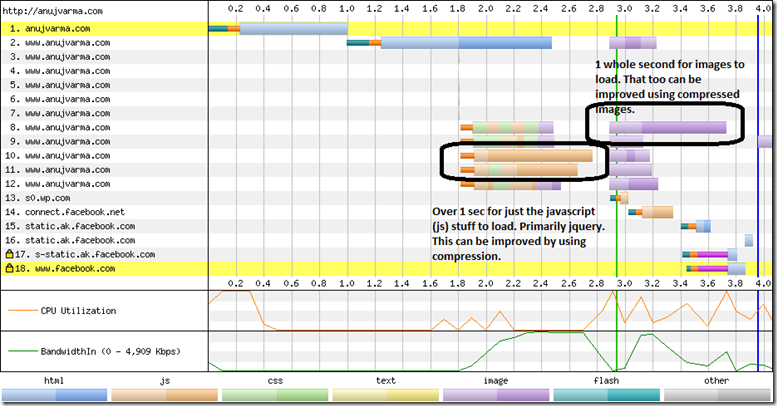
This tool gives detailed information about various pieces of your web page – and how long each took to load. This complete picture is presented in a sequential timeline showing each component’s loading start and end times. Such a view is called a waterfall view. Here is an example of a waterfall view for my website’s home page – anujvarma.com.
Summary
A metric called the TTFB can be useful in determining slowness of client or server side components. This metric can provide a quick assessment on whether the slowness is server side or client side or both.
Several free tools (notably Fiddler and WebpageTest.org) provide these metrics. Using waterfall views (timeline views), one gets a detailed breakdown of each component (images, css, js…) and how long each took to load.


Leave a Reply